On 4th November 2016 the Paris Agreement, which aims to limit the maximum global average temperature rise as close as possible to 1.5°C, came into force. However, the Nationally Determined Contributions (NDC's) proposed by each country are so far not sufficient to reach this goal. The current policies in place to limit global greenhouse gas (GHG) emission are not sufficient to keep the temperature rise below 2ºC [1].
As 68% of the world's current greenhouse gas emissions are due to burning fossil fuels, the decarbonisation of our energy supply is the single most important component to achieve the targets [2, 3]. In 2015, electricity represented only 18.5% of the final energy consumption but was responsible for 38% of the fossil fuel related and 31% of the total CO2 emissions. It is interesting to note that the emissions related to the generation of electricity have increased by 45% compared to the 40% total increase of CO2 emissions between 2000 and 2015 [3].
Global average of CO2 emissions per kWh of electricity was about 506g in 2015 [3]. Under the World Energy Outlook 2017 New Policy Scenario, these emissions would fall to 325g CO2/kWh by 2040. For Europe the situation looks somewhat better, i.e. 344g CO2/kWh in 2016 and a forecast of about 150g CO2/kWh in 2040, but this is still not sufficient for the necessary reduction of CO2 emissions to 65g CO2/kWh in order to meet the Paris Agreement [4]. Such a development is only possible under the Sustainable development Scenario, where electricity emissions in Europe should decrease to 45g CO2/kWh.
So far the European Union has proposed a binding target of at least 40% domestic reduction in greenhouse gas emissions by 2030 compared to 1990, and a 27% target for renewable energy consumed in the EU in 2030. In January 2018, the European Parliament voted for a binding target of 35% of energy generation from renewable energies by 2030. EU Member States must now decide on their position and whether or not they support this target. The consequences for renewable electricity would be that around 1200 to 1250 TWh require to be generated from solar and wind power to reach this goal (Figure 1). Of this roughly 400 TWh would come from solar power, about 20 TWh Solar Thermal Power Generation and 380 TWh PV, which would require close to 350 GW PV capacity to be installed by 2030.
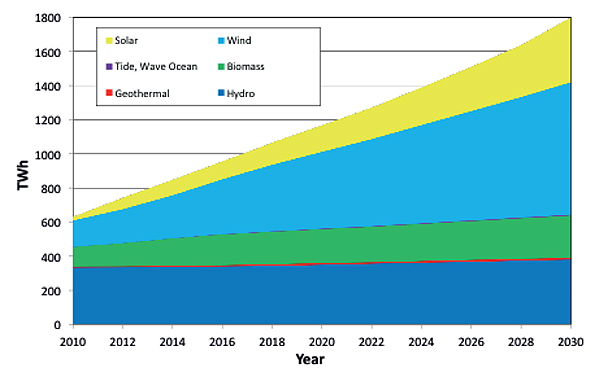
Figure 1: European electricity production until 2030 to meet the 35% RES target (extrapolation based on the impact assessment of the 2016 Market Design Directive proposal [5]).
However, with a total installed capacity of about 108 GW at the end of 2017 and annual installations between 5.1 and 7.5 GW in the last four years (Figure 2), it will be difficult to reach this target [6]. New policies are needed to enable a three times larger annual market over the next 13 years, which is needed to reach the target [7].
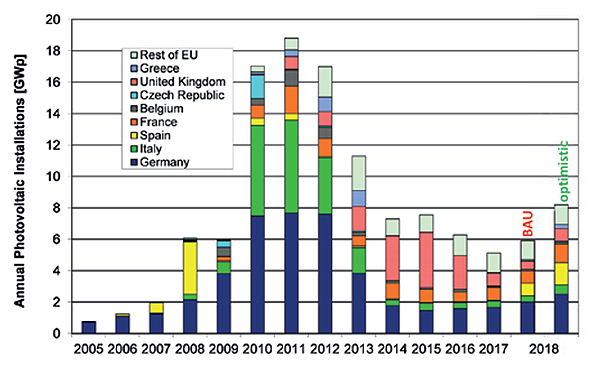
Figure 2: The annual photovoltaic installations in the European Union
What options are available to install the required capacity?
- a) large-scale or utility plants, with arrays of free-standing modules, connected to the transmission grid, and
- b) PV located on roofs or facades of buildings.
Both have different economic rationales: utility PV plants can take advantage of economies of scale to reduce investment and operational costs, and the electricity generated can be traded in wholesale markets.
Rooftop installations have higher capital costs, but the electricity can be consumed either wholly or in part on site, so the value is related to the relevant industrial or residential retail prices. Rooftop PV also brings a better geographical match between supply and demand, a factor of increasing importance as we progressively electrify the heating and cooling and the transport sectors.
Indeed, several studies suggest that roof space is not an issue, even for the most ambitious scenarios. For instance the IEA 2016 Energy Technology Perspectives reports an estimate potential in EU urban areas for over 500 GW of PV [8]. This like many other EU-wide studies relies entirely on population density data as a proxy. A more direct approach is to map actual buildings right across Europe using earth observation data. This is what the JRC is currently working on, exploiting data from the Global Human Settlement Layer (GHSL) initiative. With this we can estimate available rooftop area in blocks of 10 m x 10 m across the entire EU in both urban and rural areas. With ths data layer combined with exsiting geographic information systems already available in the JRC we can study a range of potential scenarios relevant to EU policy implementation:
- at Member state level, for medium-term planning e.g. in the proposed Energy and Climate Action Plans for 2030;
- at regional level, to support use of structural funds;
- at urban/city level, to promote local decarbonisation and clean air programmes, for instance under the Covenant of Mayors initiative [9].
The next step is to determine the relationship between the total roof-area and that suitable one for solar PV installations. For this we use very high resolution Digital Elevation Model data for a number of cities, where the resolution is high enough to detect buildings and trees. In this way we can calculate details like surface slope and orientation as well as shadows from trees and neighbouring buildings.
We then combine these data with Open Street Maps (OSM) layers to get the exact location of buildings. In this way we may calculate the PV energy output for each roof including an estimate of how much things like shadows and non-ideal installations will influence the energy production. More details can be found in a recent technical JRC report [10].
The rooftop area available for PV systems in the different NUTS2 regions was calculated using the gridded population statistics of Eurostat, which are available in 1 km resolution, as the input variable in the model [8]. This dataset permits a more detailed overview on spatial pattern of population, delineates different degrees of urbanization (cities - densely populated areas, towns and suburbs - intermediate density areas, rural areas - thinly populated areas).
The available solar rooftop area per capita was then calculated in a 1 km2 resolution as a function of the population density. The results show that the available area per capita varies between 4 m2 in the most densely populated cities to 175 m2 in scattered settlements. The total available rooftop area for PV installations per NUTS2 region is shown in Figure 3.
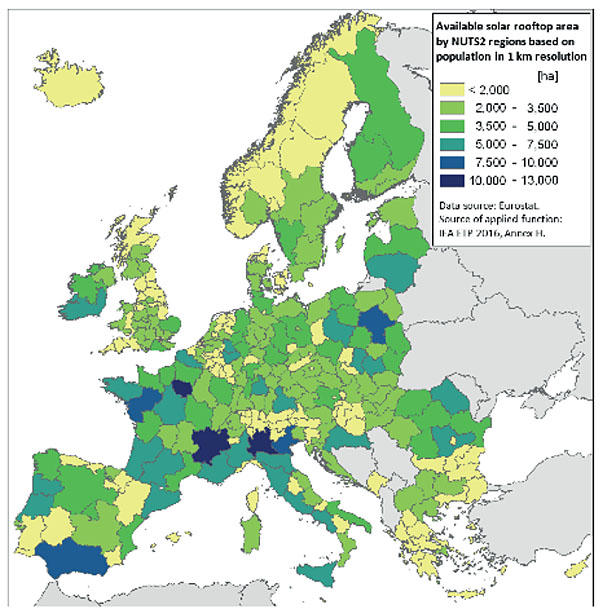
Figure 3: Distribution of available rooftop area for solar PV, aggregated at NUTS2 region level as a function of population density and total population applied in 1 km resolution [10]
To calculate the energy production of PV systems the PVGIS PV assessment tool was used [11], giving an estimate of the energy produced by PV systems at any location in Europe. These results where then corrected for the lower productivity on typical roof-top PV systems (compared to free standing systems).
The capacity was calculated under the assumption that 1 kW capacity would require 7 m2 to accommodate the PV system including all the
necessary access paths for servicing and maintenance, this results in a conservative estimate for the possible capacity.
Using these assumptions the total PV capacity was calculated that could be installed on roofs in each NUTS region. The results are shown in Figure 4.
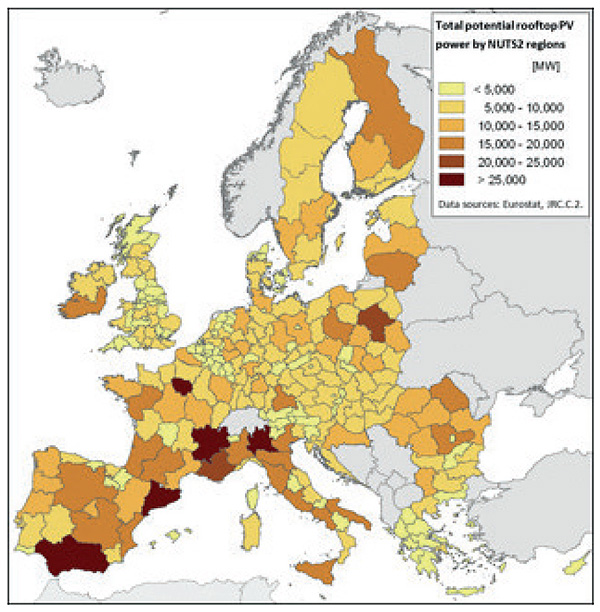
Figure 4: Potential PV capacity per NUTS2 region
Looking further into the future, these calculations show that if all suitable rooftop area could be used for PV generation this would result in more than 1500 TWh of electricity generation. This represents a contribution of just over 35% of energy from PV in a possible 100% Renewable Energy supply scenario [12]. This scenario, produced by the Lappeenranta University of Technology with an open source model, gives a breakdown of the percentage of electricity produced by different renewable technologies and electricity demand in the different Member States.
Compared to the available potential, the 380 TWh electricity needed from PV systems to reach 35% renewable energy use by 2030 requires only a quarter of the total area. The percentage of the total available rooftop area in each country for the 2030 scenario was calculated and is presented in Figure 5.
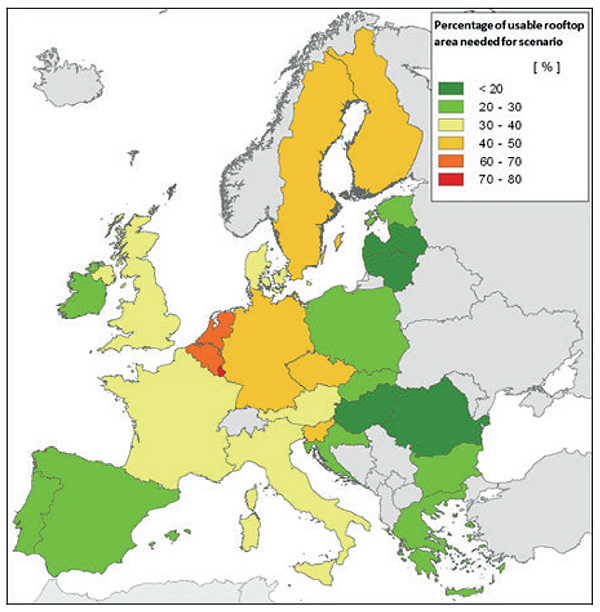
Figure 5: Percentage of available rooftop area that would be necessary for the 2030 scenario, provided all PV installations would be on roofs.
With the exception of Belgium, Luxembourg and the Netherlands, where more than 60% of the suitable rooftop area is required all other Member States have an area demand below 50% of the available rooftop areas (Figure 5).
How can we realise this great potential and help ourselves deliver on the Paris agreement?
Hardware costs should no longer be a barrier. Already in 2017 the costs of direct current (DC) electricity in central Europe at the PV module level have dropped to less than 0.02 EUR/kWh. In efficient markets the costs of systems is around €1300/kW, with potential to close the gap further on large-scale ground mounted systems, but economies of scale put limits on this ultimately. A lot however needs to be done to bring prices in all EU regions to the benchmark levels in major markets. Soft costs are another area where huge improvement can be made. Community initiatives and de-risking instruments can also play a key role.
Last but not least, the Energy Performance Building Directive and the increasing requirements for net zero energy buildings is another driver. JRC estimates that approximately 1.5 million new residential buildings are constructed per year, and 2.5 million undergo substantial renovation. Adding 10 m2 PV to each project would potentially add 5.7 GW per year. With commercial buildings even more dynamic and the addition of retrofitting existing buildings the potential for PV to contribute significantly to the Paris Goals are clearly viable.
Notes:
[1] Watson R, Carraro C, Canziani P, Nakicenovic N, McCarthy JJ, Goldemberg J and Hisas L. The Truth About Climate Change, September 2016, ISBN 978-0-9831909-1-2
[2] International Energy Agency, 2017, Key World Energy Statistics 2017
[3] International Energy Agency, CO2 Emissions from Fuel Combustion, October 2017, ISBN 978-92-64-27819-6 ISSN 2219-9446
[4] International Energy Agency, World Energy Outlook 2017, ISBN: 978-92-64-28230-8
[5] Commission Staff Working Document, SWD(2016) 410 final, 30 November 2016
[6] A. Jäger-Waldau, PV Status Report 2017, October 2017, European Commission, ISBN 978-92-79-74072-5
[7] A. Jäger-Waldau, Snapshot on Photovoltaics – February 2018, submitted to EPJ Photovoltaics
[8] International Energy Agency, Energy Technology Perspectives 2016, Annex H: Rooftop Solar PV Potential in Cities, ISBN PRINT 978-92-64-25234-9 / PDF 978-92-64-25233-2
[9] http://www.covenantofmayors.eu/
[10] K. Bódis, T. Huld,., I. Pinedo Pascua, N. Taylor, A. Jäger-Waldau, Technical potential of rooftop photovoltaics in EU member states, regions and cities, JRC Technical Report, 2017, JRC 110353
[11] Joint Research Centre, Photovoltaic Geographical Information System (PVGIS), http://re.jrc.ec.europa.eu/pvgis/
[12] M. Ram, D. Bogdanov, A. Aghahosseini, A.S. Oyewo, A. Gulagi, M. Child, H-J. Fell, C. Breyer; Global Energy System based on 100% Renewable Energy – Power Sector (2017); Lappeenranta University of Technology, Lappeenranta, Finland
Contact Details:
Dr. Arnulf Jäger-Waldau
Email: arnulf.jaeger-waldau@ec.europa.eu
Website: https://ec.europa.eu/jrc/en/research-topic/photovoltaics